Logging In
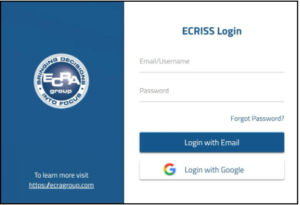
- Go to https://ecragroup.com/user-login/.
- Click the ‘ECRISS login’ button.
- Click the ‘Strategic Dashboard’ icon.
Click HERE for full ‘Login’ instructions.
Click HERE for full ‘App Settings’ guide.
Home Section
- Click ‘Admin Mode’.
- On the ‘Home’ tab, enter your district’s strategic plan, image(s), and/or any district highlights you want to showcase.
- After completion, hit the ‘Save’ button in the bottom right corner.
- Click ‘Exit Admin Mode’ to finalize and publish the page.
Click HERE for full ‘Home page’ instructions.
Indicators Section
- Click the ‘Indicators’ section.
- Click ‘Admin Mode’.
Click HERE for full ‘Indicators’ page instruction guide.
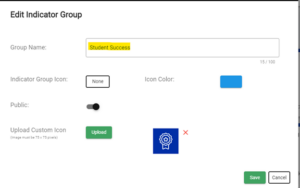
To edit an Indicator Group –
- Click the ‘Menu’ ellipses next to the indicator section and click ‘Edit’.
- Edit the Indicator Group name and any additional fields.
- Click ‘Public’ if you want the information public; otherwise, leave it unchecked.
- Click ‘Save’.
Click HERE for full ‘Indicators’ page instruction guide.
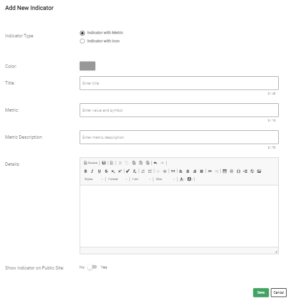
To add an Indicator –
- Click ‘Add New Indicator’.
- Complete the required fields.
- Click ‘Public’ if you want the information public; otherwise, leave it unchecked.
- Click ‘Save’.
Click HERE for full ‘Indicators’ page instruction guide.
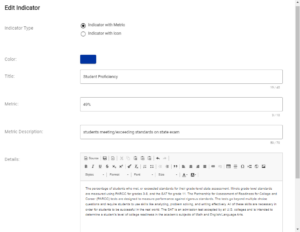
Edit an Indicator Tile –
- Click the ‘Menu’ ellipses next to the indicator tile and click ‘Edit’.
- Enter the information for the Indicator tile.
- Click ‘Public’ if you want the information public; otherwise, leave it unchecked.
- Click ‘Save’.
Click HERE for full ‘Indicators’ page instruction guide.
Move a tile –
- Click the dots in the top left corner of the Indicator tile.
- Click and drag the tile to your desired location.
Click HERE for full ‘Indicators’ page instruction guide.
Create a chart –
- Click the ‘Menu’ ellipses next to the indicator section and click ‘Charts’.
- Fill in the Subheader and Description sections.
- Click ‘Add Chart’.
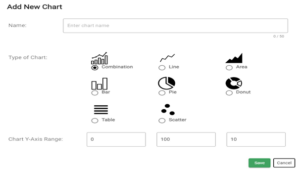
- Enter your chart name, select the chart type, and enter values for the Y-Axis.
- Click ‘Save’
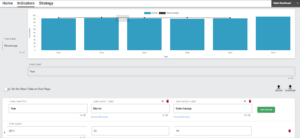
- Complete all highlighted fields displayed in the example of a combination chart.
- Add or delete any rows or columns as needed.
- Change colors of series or border by selecting the ‘Format Data Series’ button.
- Click ‘Save’.
Click HERE for full ‘Indicators’ page instruction guide.
Strategy Section
Accessing Admin Mode:
- Click ‘Admin Mode’ to access the administrative functions.
Creating a New Goal:
- In Admin Mode, click the ‘New Goal’ button.
Enter your organization’s goal in the provided field.
Click ‘Save’ to save the goal.
Adding Objectives to a Goal:
- Click ‘New Objective’ for the goal you just created.
- Enter your district’s objective for the goal.
- Specify the percentage of completion (from 0 to 100 percent).
- Click ‘Save’ to save the objective.
Repeat for Additional Goals:
- Repeat the process for each of your organization’s goals.
- Click ‘New Goal’, enter the goal, and save.
- For each goal, click ‘New Objective’, enter the objective and completion percentage, and save.
Editing Objectives:
- To edit an objective, locate the respective goal or objective.
- Click the three dots associated with the goal or objective.
- Choose the ‘Edit’ option.
- Modify the necessary information.
- Click ‘Save’ to save the changes.
Click HERE for full ‘Strategy’ page instruction guide.

