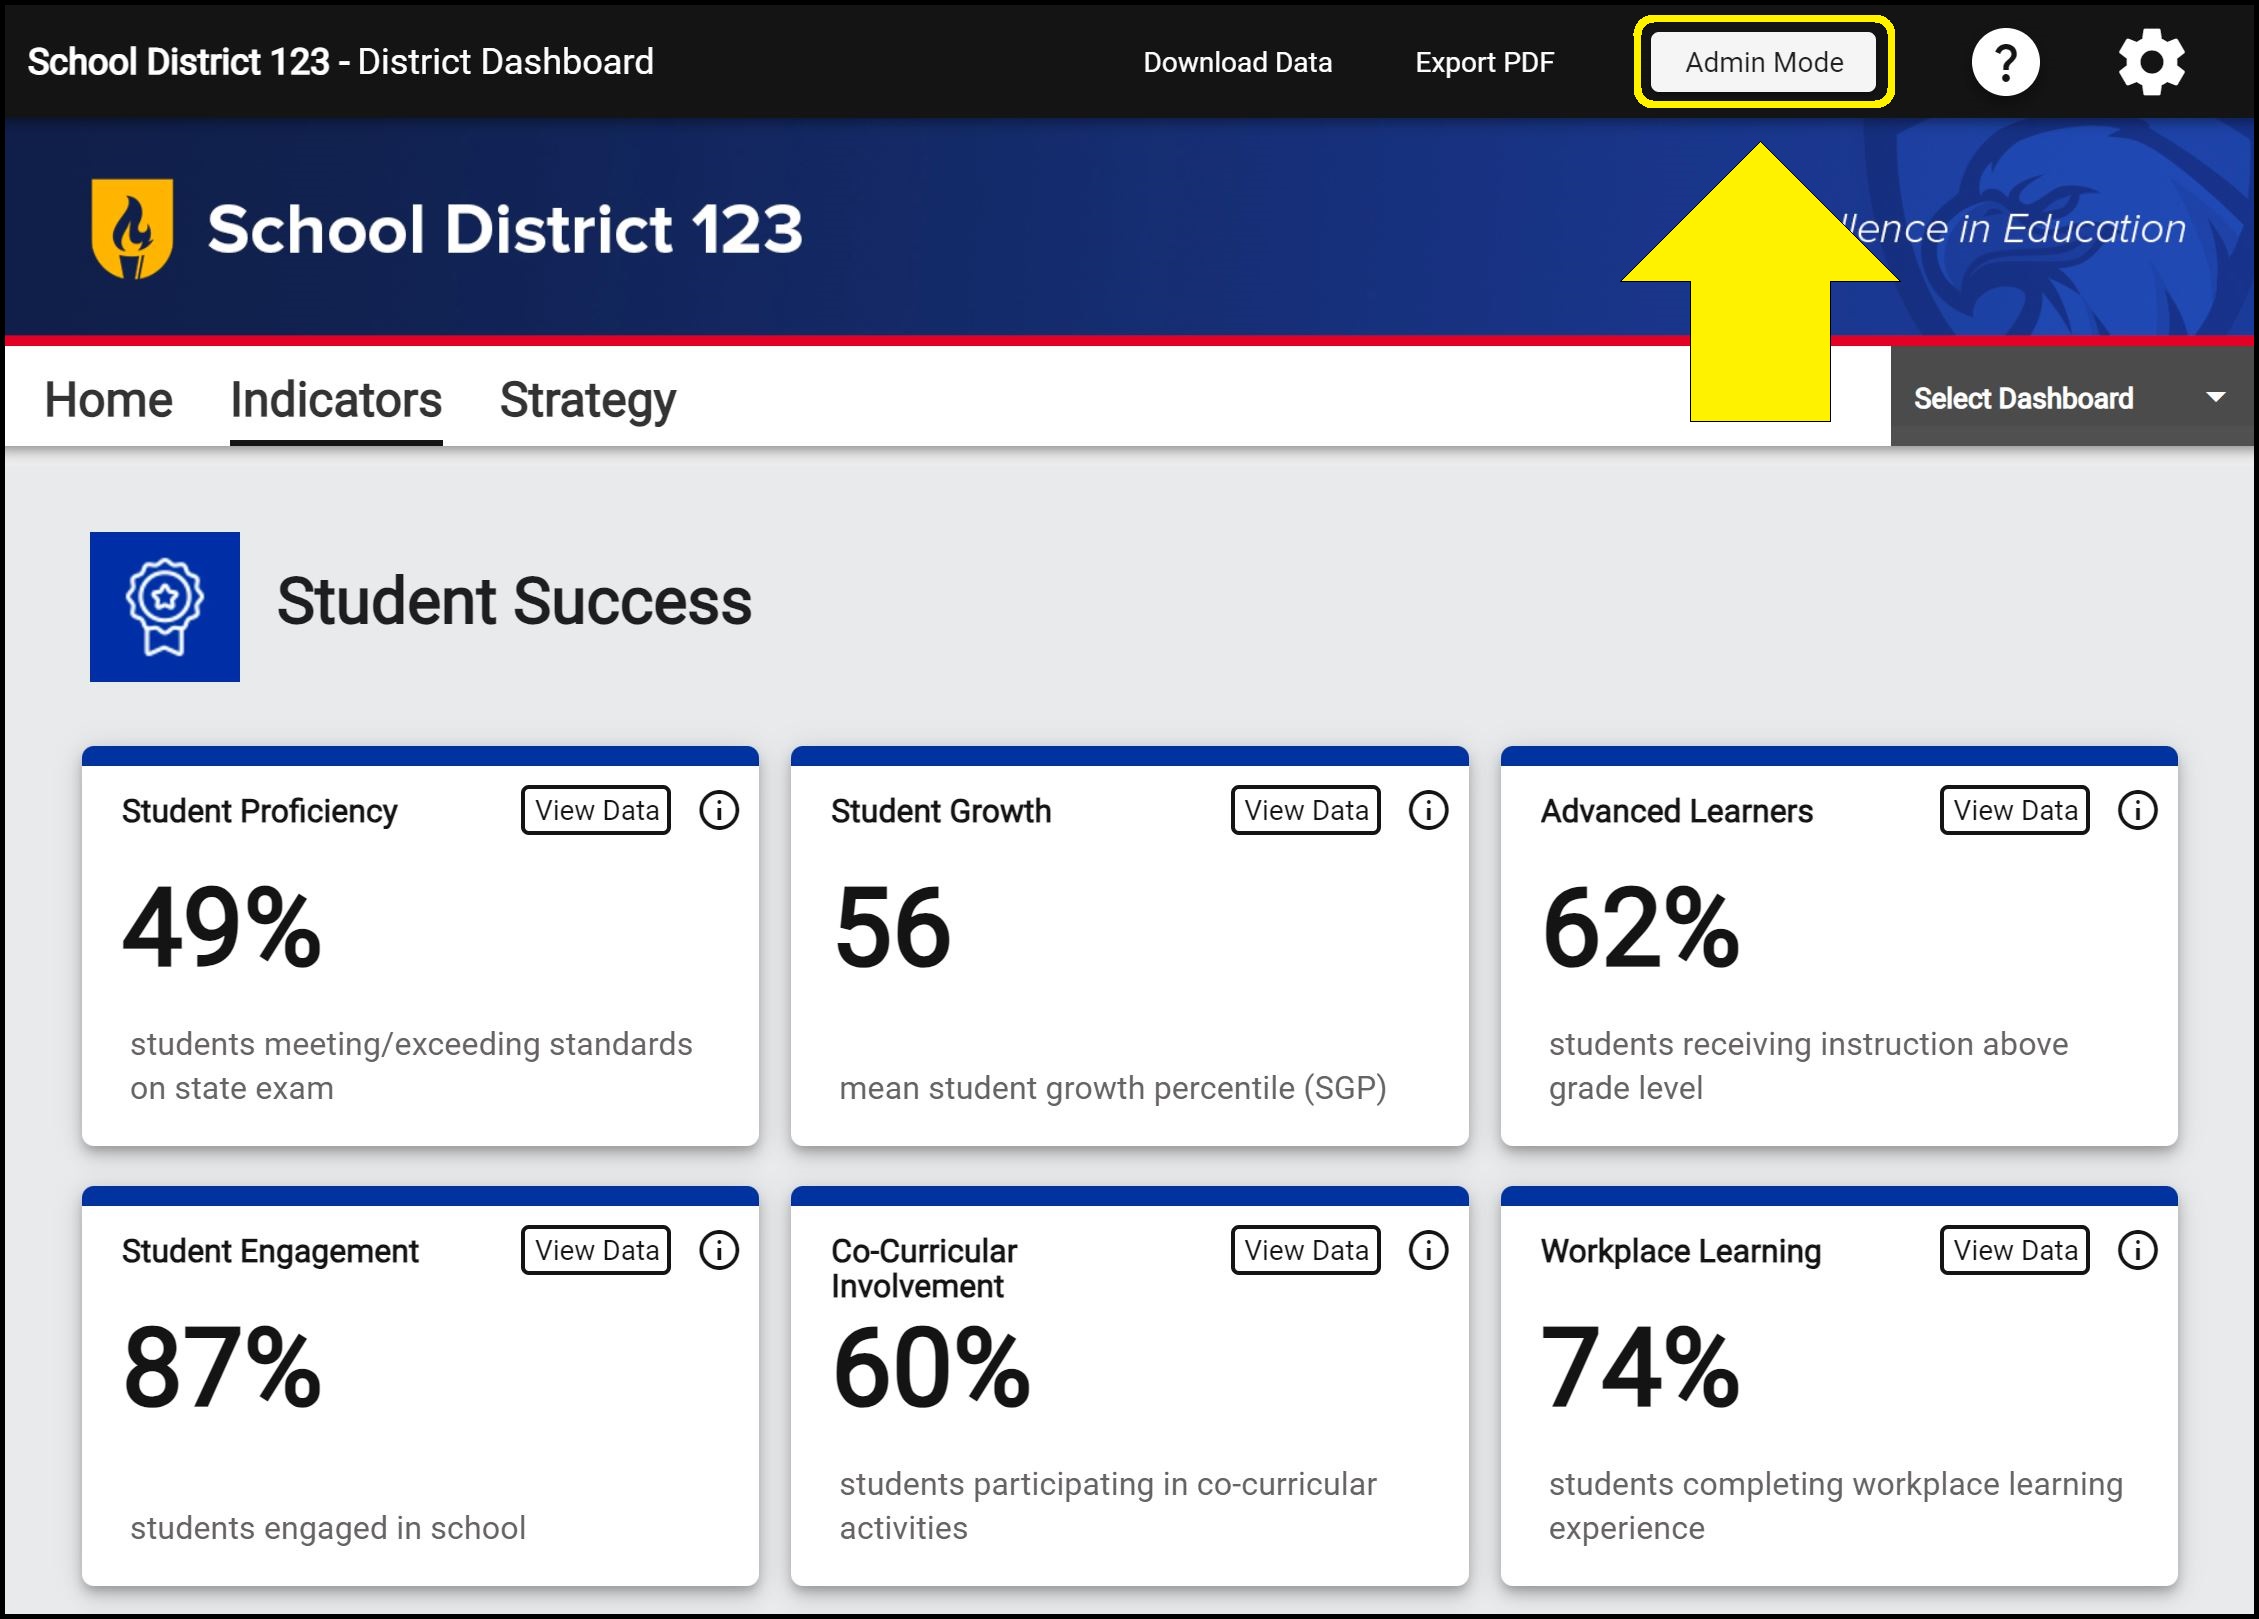
The Indicators page allows districts to create and manage performance indicators and benchmarks to monitor progress toward strategic goals. The Indicators page also provides visualization of trend data and comparisons to meaningful benchmarks.
View a sample Indicators page
Indicators page components
Within the Indicators page, there are Indicator Groups, Indicator Tiles, and Indicator Charts.
1. Indicator Groups contain Indicator Tiles, which in turn contain Indicator Charts.
2. Indicator Tiles belong to Indicator Groups and contain Indicator Charts. Indicator Tiles show a title in the top left corner, a metric or icon in the middle of the tile, and a description at the bottom of the tile. Indicator tiles can also have an i button in the top right corner that can be customized to display more information, pictures, videos, and other desired content. If Indicator Charts exist for an Indicator, a ‘View Data’ button in the top right corner takes you to the Indicator’s chart page.
3. Indicator Charts belong to Indicator Tiles, which belong to Indicator Groups. Indicator Charts can display historical, subject, and subgroup data.
Editing the Indicators page
In the top right corner of the Indicators page, an Admin Mode button allows you to edit and customize the Indicators page content.
When the Indicators page is in Admin Mode, you can create, edit, and delete Indicator Groups, Indicator Tiles, and Indicator Charts; rearrange the content on the page; create charts to display historical, subject, and subgroup data; and more.
– How to add, edit, duplicate, or delete an Indicator Group
– How to add or remove an icon next to an Indicator Group name
– How to make the Indicators page public and copy the public dashboard Indicators page link


