Introduction
On your indicators page, after creating a group and adding your indicators, the next step (if needed) is to add charts or graphs within that indicator. This section will show you how to add a chart or graph to an indicator. it will also show you how to add and edit your chart or graph.
How to Add a Chart or Graph
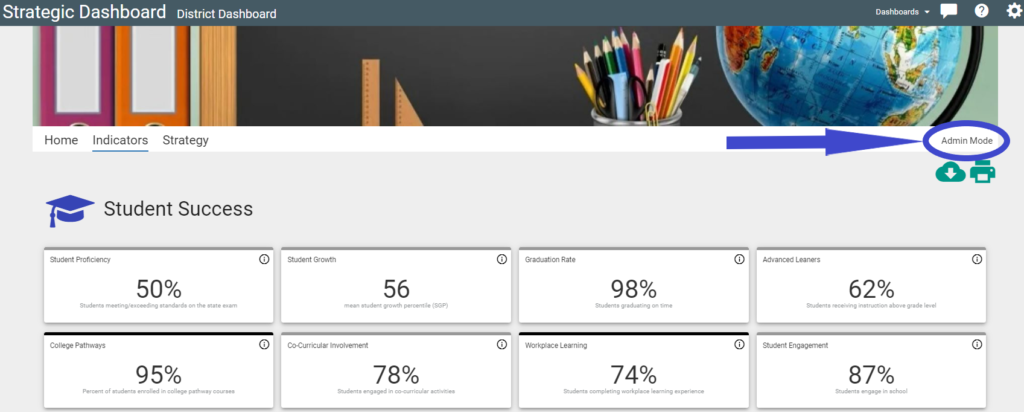
Navigate to your indicators page and click an indicator that has already been created. Note: Do not click in the information ‘i’ icon as that will display a window displaying information about the indicator.
1. Click on the ‘Admin Mode’ link to begin editing.
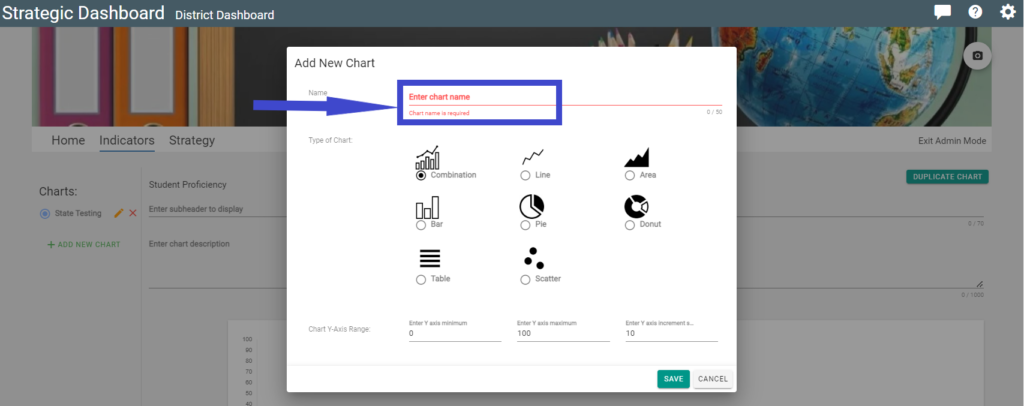
2. Click ‘Add New Chart’ on the left column.
3. Enter the desired Chart Name.
4. Select the Type of Chart you want to display.
5. Enter the parameters in the ‘Chart Y-Axis Range’ (and other fields as needed per chart).
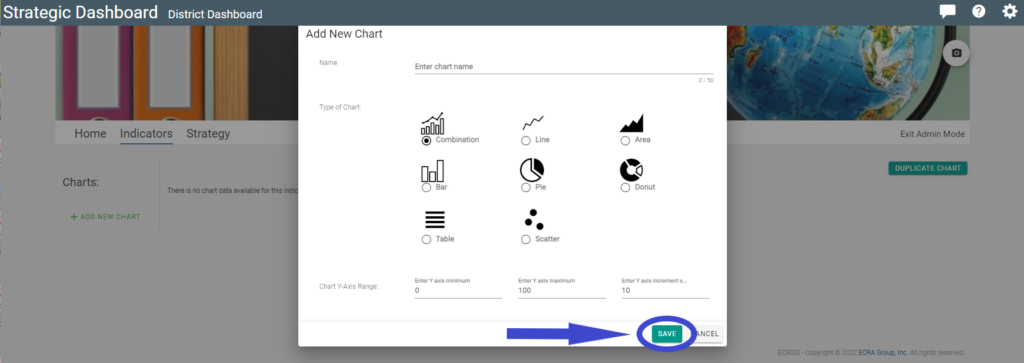
6. Click the ‘Save’ button on bottom right to save and insert the chart.
PLEASE NOTE – Any action performed during the following steps will automatically be saved. Once entered, the data becomes live data.
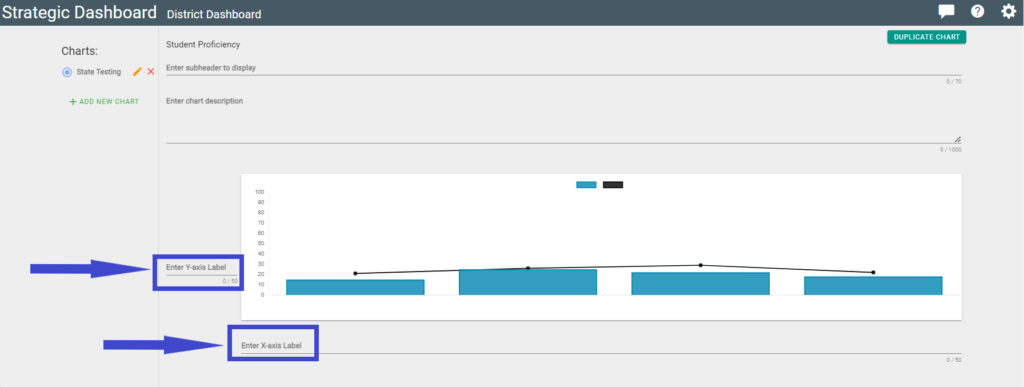
7. After adding the chart, you are provided the ability to enter a sub-header to display and enter a chart description. Both of these fields are optional.
9. Adjacent to the chart or graph, you can change the ‘Y-axis label’ and the ‘X-axis label.’ Click on the field and begin adding your desired labels.
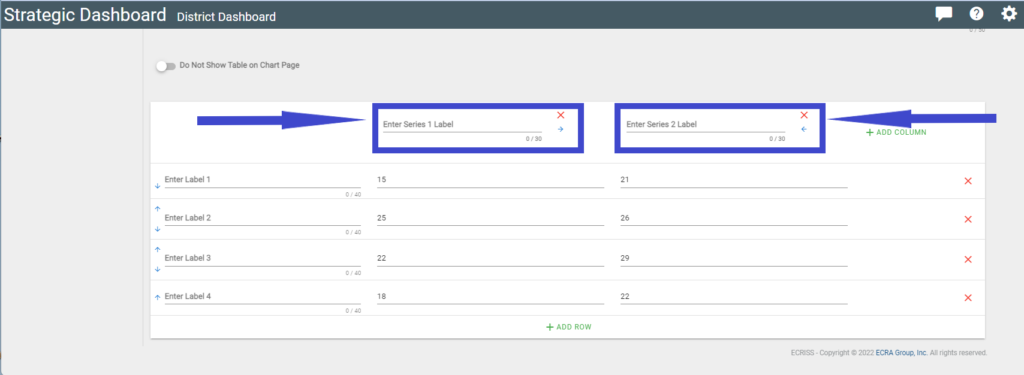
10. To add text to the legend, enter your appropriate text in the ‘Enter Series X Label’ field. This text will now be displayed on your graph in the legend.
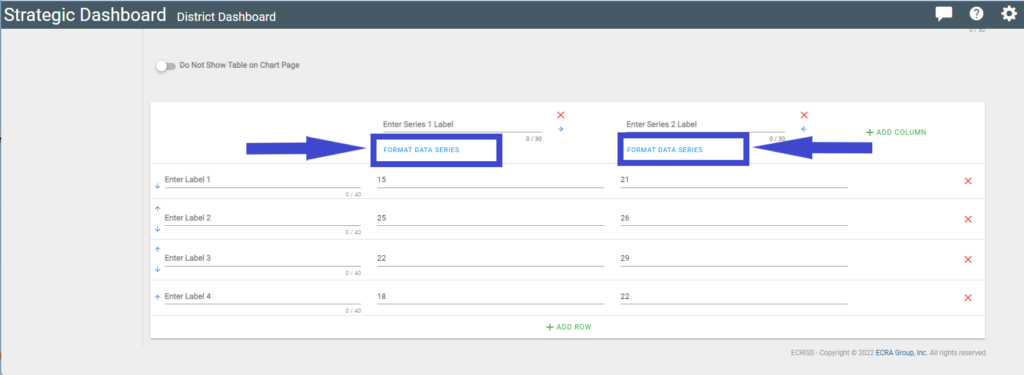
11. Click the ‘Format Data Series’ text to change parameters of the items being edited. In this line graph example, the color and line thickness can be changed or updated.
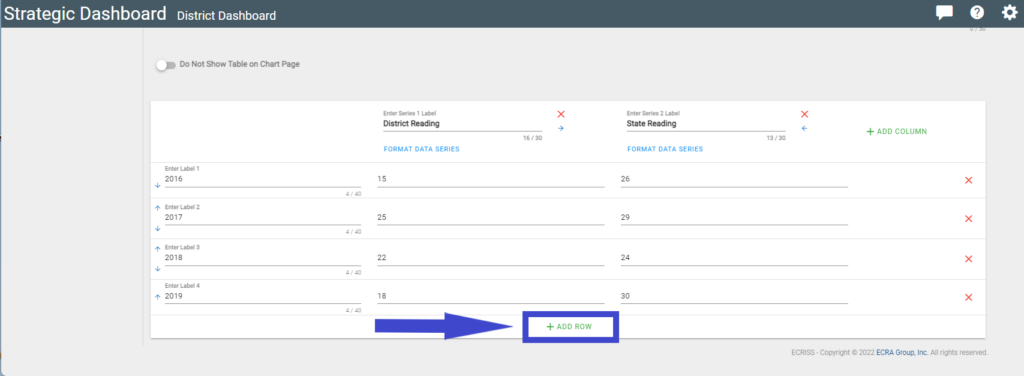
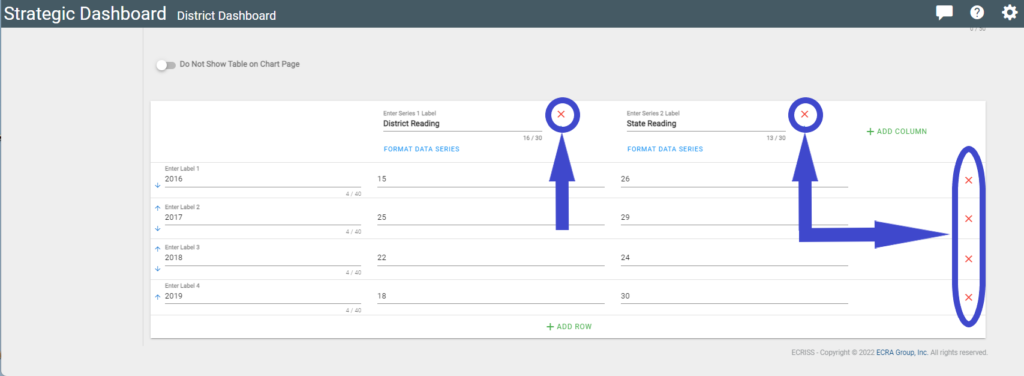
12. Begin adding data to the chart. You can add custom labels to appear on the graph. In the example below, the year was used.
13. Clicking the ‘+ Add Row’ text will add another row for data.
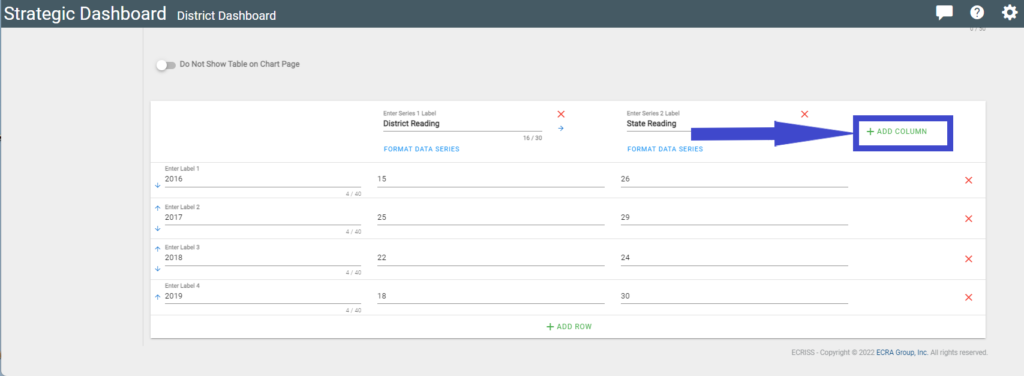
14. Clicking the ‘+ Add Column’ text will add another column of data. In this example, it will add another line to the graph.
15. Rows and Columns can be deleted by clicking the red ‘X’ adjacent to the item to delete.
16. To view chart, once created, click ‘Exit Admin Mode’.

