Introduction
You may have already created charts or graphs within indicator tiles. This section will show you how to change the x-axis and y-axis labels.
How to change the x-axis and/or y-axis on a chart or graph
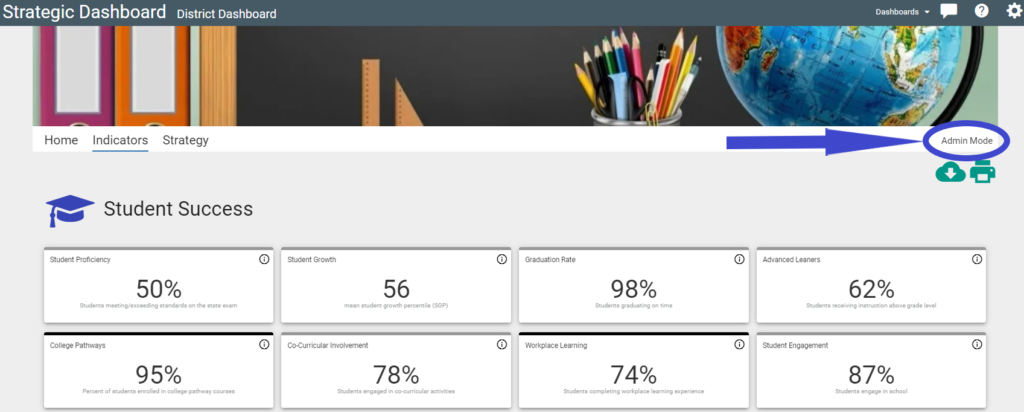
Navigate to your indicators page and click an indicator that has already been created. Note: Do not click in the information ‘i’ icon as that will display a window displaying information about the indicator.
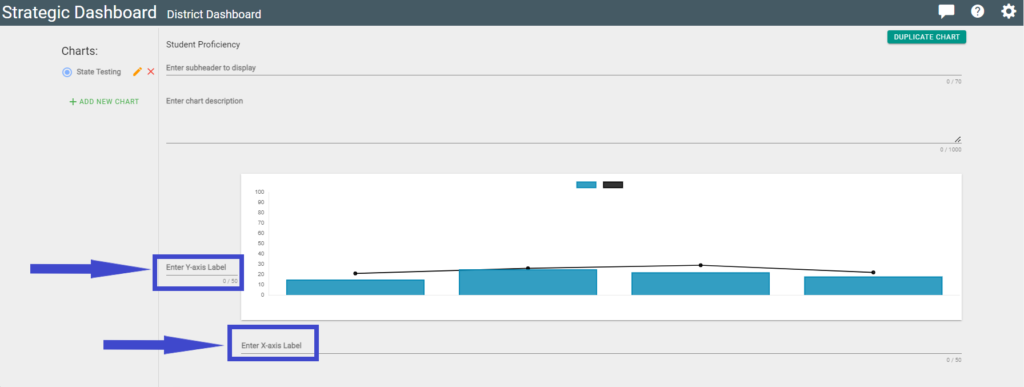
You will see that there are 2 methods to change the names of the X-axis and Y-axis names (numbers 2 & 3 below). Either method is fine.
1. In the indicator selected, click on the ‘Admin Mode’ link to begin editing.
2. Adjacent to the chart or graph, you can change the ‘Y-axis label’ and the ‘X-axis label.’ Simply click on the field and begin adding your desired labels.
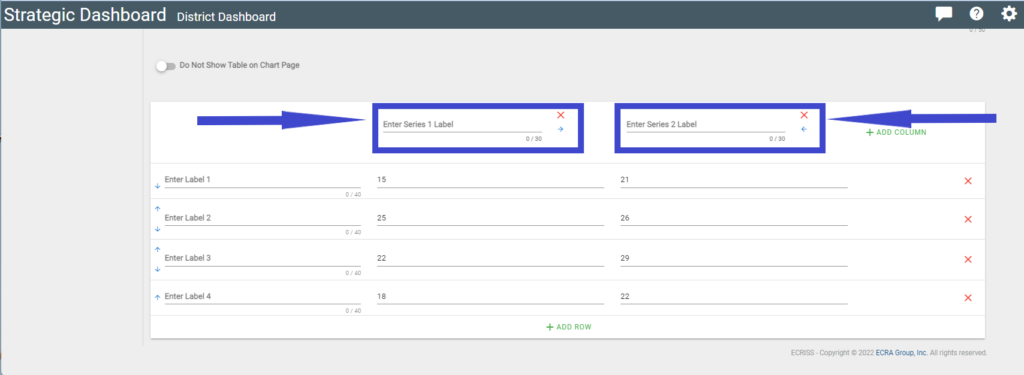
3. To add text to the legend, enter your appropriate text in the ‘Enter Series X Label’ and/or the ‘Enter Series Y Label’. This text will now be displayed on your graph in the legend.
4. Click ‘Exit Admin Mode’.


