Introduction
You may have already created charts or graphs within indicator tiles. This section will show you how to change the chart or graph type.
How to change the Chart or Graph type
Navigate to your indicators page and click an indicator that has already been created. Note: Do not click in the information ‘i’ icon as that will display a window displaying information about the indicator.
1. Click on the ‘Admin Mode’ link to begin editing.
2. Click the ‘Edit’ icon to the left of the page.
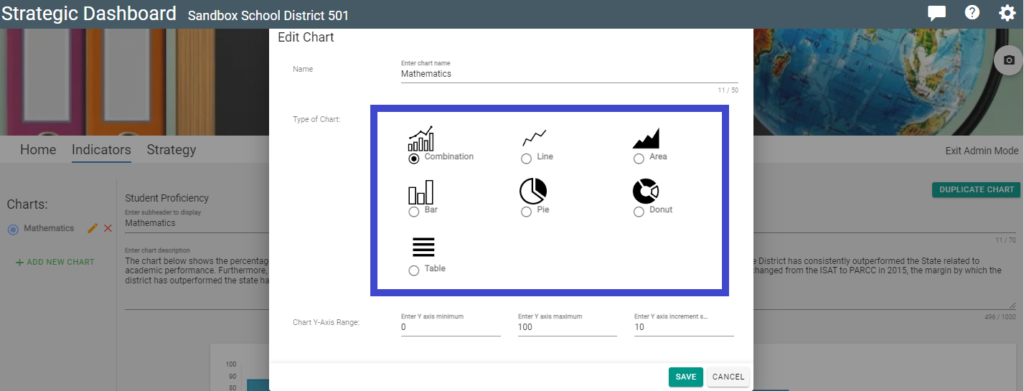
3. Select the desired chart type.
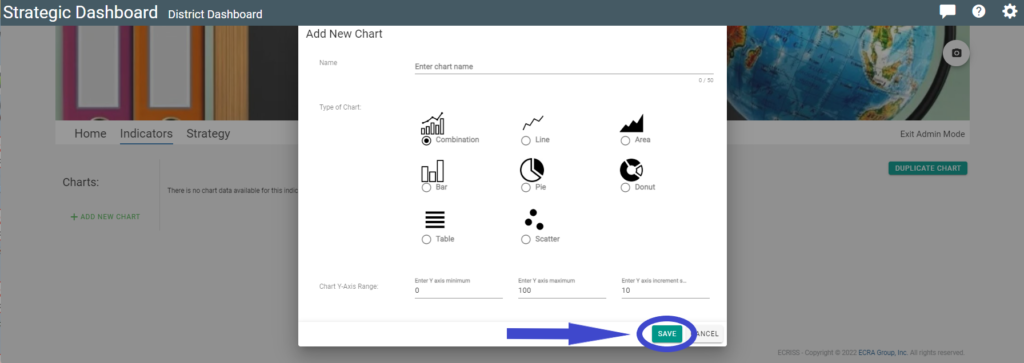
4. Be sure to click the ‘SAVE’ button to save your chart type.
5. Click on ‘Exit Admin Mode’.


