Introduction
You may have already created charts or graphs within indicator tiles. This section will show you how to add or delete rows or columns on previously created data tables.
How to add or delete rows and columns on a data table
Navigate to your indicators page and click an indicator that has already been created. Note: Do not click in the information ‘i’ icon as that will display a window displaying information about the indicator.
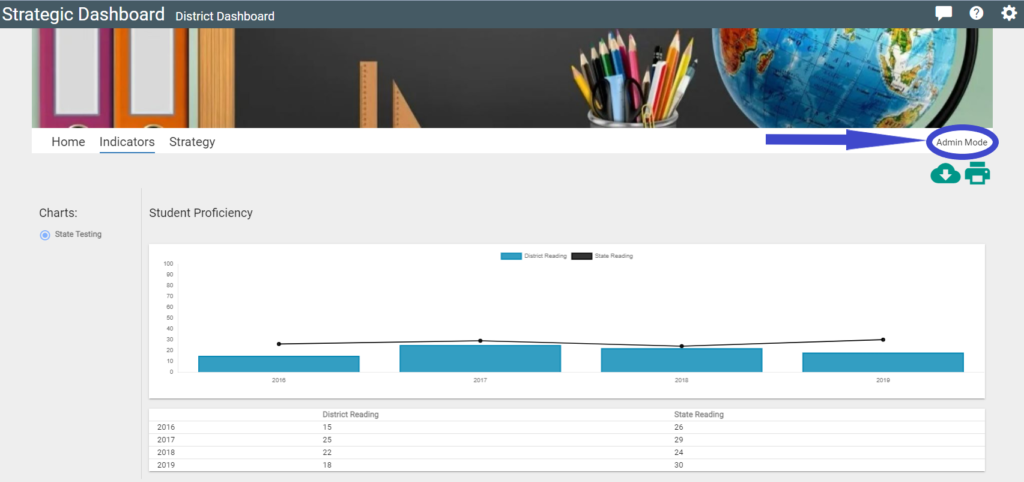
1. In the indicator selected, click on the ‘Admin Mode’ link to begin editing.
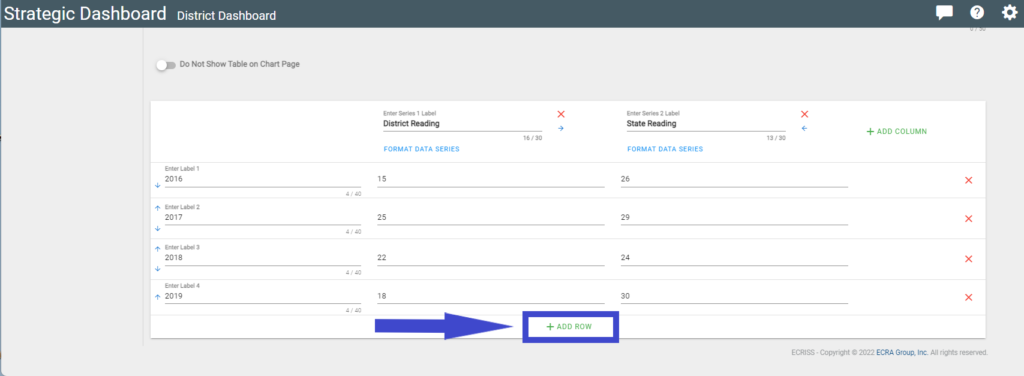
2. Click the ‘+ Add Row’ text to add another row for data.
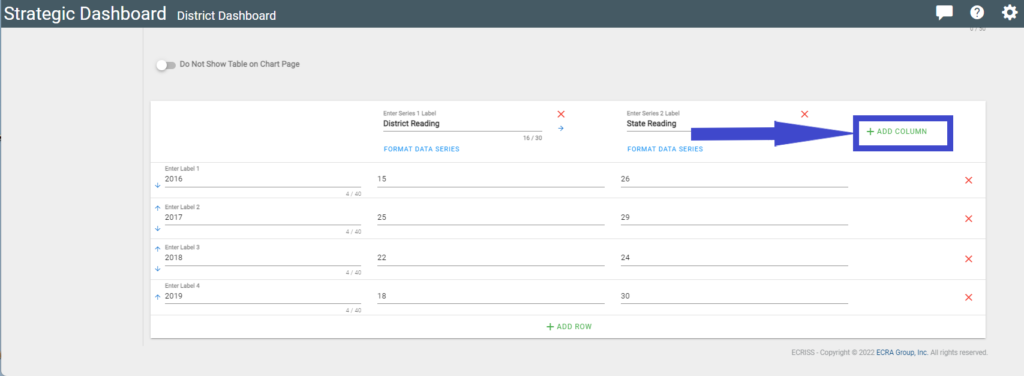
3. Click the ‘+ Add Column’ text to add another column of data.
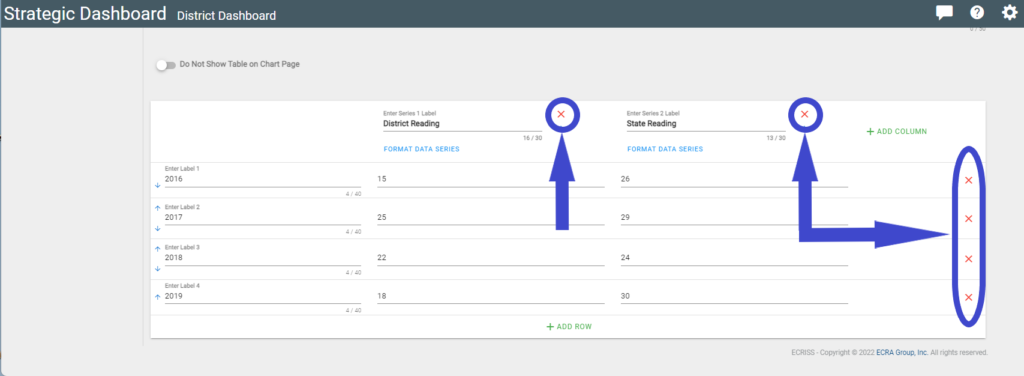
4. Rows and Columns can be deleted by clicking the red ‘X’ adjacent to the item to delete.
5. To view a chart, once created, click ‘Exit Admin Mode’.


