Introduction
This section will show you how to use the School Improvement Application to identify students for various programming opportunities within your school or district. This article will focus on the use of Student Growth for identification.
Using Student Growth Data for Program Identification
1. Identify the data to review.
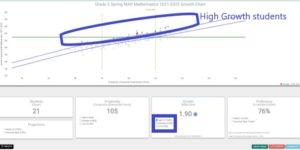
For example, you may select proficiency and growth data for Grade 5 Spring MAP Mathematics, highlighted below in this growth dashboard.
2. Click the chart data to review.
Using the grade 5 example, let’s review growth on Spring MAP Mathematics. To examine a growth chart, select the growth chart icon ![]() in the far-right column on the growth dashboard.
in the far-right column on the growth dashboard.
3. Select the students you would like to focus on.
Using the grade 5 example, we will select students with high growth. You may choose any of the combinations of Propensity, Growth, and Proficiency listed below. In the
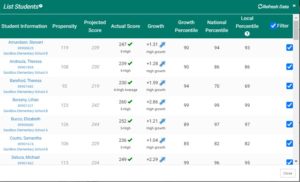
3. You may review individual student data by Clicking the “List Students” button ![]()
Using the grade 5 example of students with high growth, we see the high growth students.
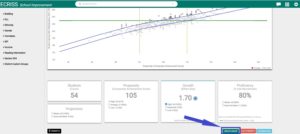
4. To save this group of students for monitoring or program placement, Click the “Create Group” button ![]() on the main scatter graph page (see below).
on the main scatter graph page (see below).
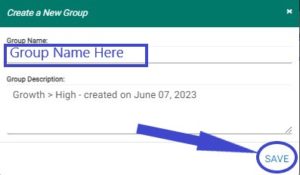
5. This will place all of your students in a group for placement or monitoring, and you may Name your group and Save it.
In Summary, you may also take action with the student list in several ways, listed below:
- Clicking the List Students
 button below the growth chart to review individual students.
 - Generating a .pdf version of a chart and student list by Clicking the print icon.

- Downloading a .csv file of chart data by Clicking

- Identifying students for focused strategies and then creating a group (as seen above in 4 & 5)


