Introduction
This section will give you an introduction to the foundational principles of using growth and proficiency as measures of academic success.
Key Terms & Definitions
Propensity – A composite achievement score of past student test performance, scaled to represent student achievement with a mean of 100 and standard deviation of 16.
Projected Score – The score a student is projected to earn on the designated assessment, based on a student’s propensity (composite achievement) score.
Actual Score – The actual score a student earned on an assessment.
Benchmark – Score necessary to meet standards. This is notated with “✓” (met benchmark) or “–“ (did not meet benchmark), next to the actual score.
Growth Percentile – Indicates how a student’s growth compares locally within the district to other students with similar historical scores in the same grade. A student with a growth percentile of 50 percent grew at an expected rate, while a student with a growth percentile of 80 percent grew at a rate higher than 80 percent of his or her peers.
National Percentile (NP) – Indicates how a student’s score compares to other students in the same grade nationally.
Local Percentile (LP) – Indicates how a student’s score compares to other students in the same grade locally.
Growth – Measure of growth (positive or negative) that a student demonstrates compared to expected growth across the district in prior years. Growth can be positive (for the students who did better than expected), negative (if they scored lower than predicted), or zero (if they met their projected score).
Understanding the difference between Proficiency and Growth
Proficiency – References attainment at one point in time. For example, status can refer to an individual student’s score on a test or the percentage of students who met the state standards in Math or ELA.
Growth – Examines how much students learn, or grow, across multiple assessments over time.
Understanding the Local Growth Model
The local growth model is the term used to define student growth from a school district’s local context. Data are often compared to state or national data sets for benchmarking purposes. The local growth model is equivalent to running an individual race and comparing a district’s results to itself over time.
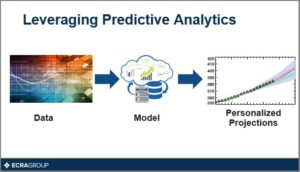
Leveraging Predictive Analytics
Powered by ECRA’s propensity model, we create longitudinal models with local norms and personalized projections for every student so you have a rigorous, scientific framework to evaluate the impact that you are having on student outcomes.


