John Gatta, Ph.D. is Chief Executive Officer (CEO) of ECRA Group. In addition to his responsibilities at ECRA Group, John is an Assistant Professor of statistics and predictive analytics at Northwestern University, where he also serves as Director of Research. His unique blend of academic, technical, management and leadership experience gives him keen insights into how schools can best adopt research and analytics as a core strategy for quality improvement. As CEO of ECRA Group, he also serves as chief architect of ECRA's analytic infrastructure related to data structures, data warehousing, statistical algorithms and reporting.
The fundamental purpose of setting school improvement goals is to assess the effectiveness of improvement efforts. The utility of the school improvement process rests on the inferences one can draw from meeting a goal. For example, a typical school improvement goal may be “increase the percentage of students meeting standards in grade 4 reading by 5%. While this type of goal is specific and concise, the results will provide little to no information as to the effectiveness of improvement efforts. Why? Because increasing grade 4 reading by 5% is likely an arbitrary goal that is unrelated to school performance and not evidence-based.
ECRA Group CEO, John Gatta, was interviewed by WGN America’s NewsNation regarding the impact of COVID-19 on student learning.
Join AASA’s guest, data analytics expert Dr. John Gatta in examining how to quantify learning loss and develop personalized learning recovery plans
Measuring learning loss requires that we recognize that student growth is personal in the sense that every individual student’s learning trajectory leading up to the pandemic was different.
Documenting learning loss is important as the effects of school closures on learning loss are likely differential and asymmetric, resulting in large losses for some students, and negligible or negative losses for other students.
Despite widespread use of effect sizes across industries as a standardized measure of impact, effect size calculations remain one of the most incorrectly applied and misinterpreted statistics. An effect size is nothing more than a standardized comparison, or “effect” , that captures the difference between an average value and a meaningful comparison in the metric of standard deviation.
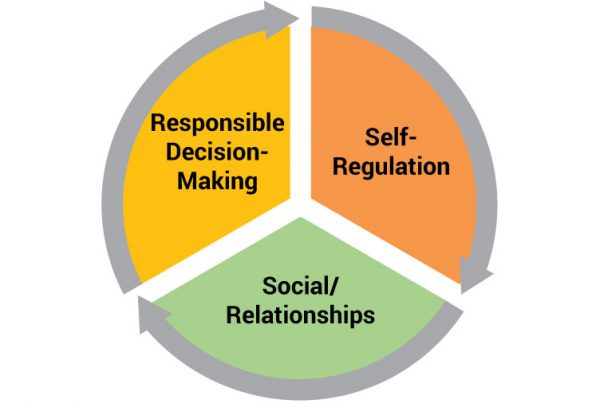
Social and emotional learning is about understanding who students are, not what they know. It’s internalizing an awareness that our biological systems are wired so that our emotions and interests drive our attention and, ultimately, our progress toward goals.
For chief executives, prioritizing SEL is a strategic issue. Effective implementation of SEL policies starts with the school district developing a clear and compelling vision for SEL that defines tangible outcomes the organization is striving to achieve.
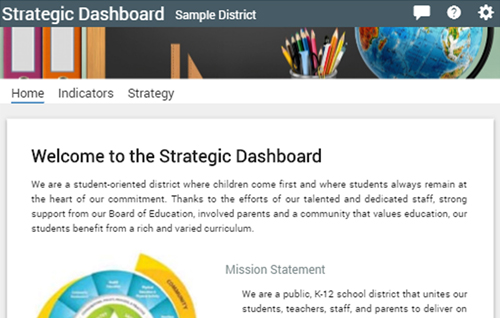
The ability to articulate and substantiate a compelling story of student success and school quality ultimately speaks to the return on investment that schools provide the communities they serve. School quality and student success are a matter of definition. For years, federal policy has controlled the definition of student success and school quality as predominately how students perform on state assessments. As educators, we know there are many additional outcomes that predict student success and align closer to the values of local communities. The story of local school districts is more comprehensive than what state report cards capture.
The state report card is only part of the story – unless the missing parts are never told. Absent the rest of the story, the incomplete story told via the state report cards becomes the full story. The idea is to provide communities the full story.
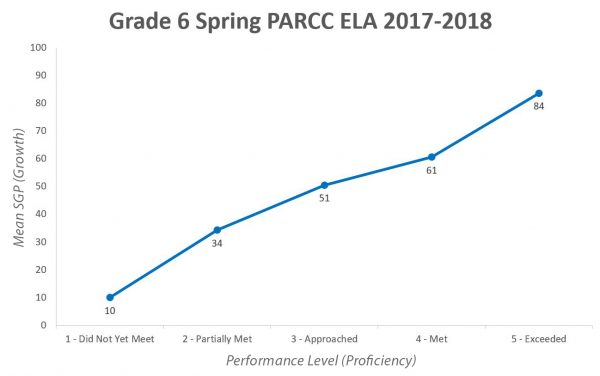
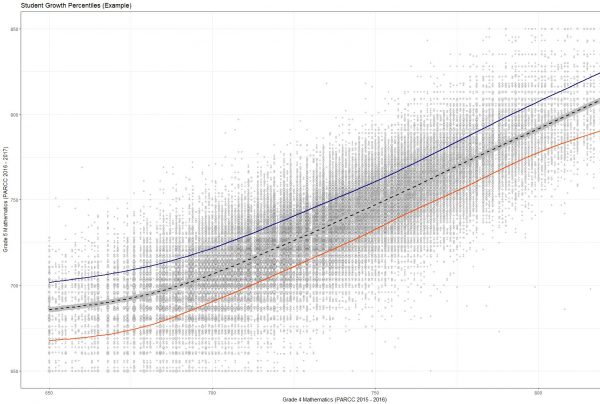
The Illinois State Board of Education (ISBE) recently released student growth percentiles (SGPs) to Illinois school districts in preparation of the new school accountability system and the launch of the new Illinois school report card. While incorporating student growth into the school accountability system is a step in the right direction, it is important to recognize that ISBE SGP results are reported within an accountability context not a school improvement context.
Based on recent information provided by the Accountability Technical Advisory Committee’s (TAC) recommendations to ISBE, it is likely that ISBE will move away from linear regression toward Student Growth Percentiles (SGPs) as a means to measure student growth under the new school improvement and accountability system.

