ECRA helps school district leaders predict what’s possible for students. By combining decades of K-12 expertise with predictive analytics, research, and purpose-built solutions, ECRA helps districts understand where students are headed, make more informed decisions, and take action to improve student outcomes.
Dr. John Gatta, CEO of ECRA Group, recently talked with Jason Leahy, Executive Director for Illinois Principals Association (IPA), on the topic of assessment and accountability. They discuss the latest release of Illinois Report Card data and how districts can use ECRA’s Illinois Report Card Analysis report to communicate more effectively to boards and communities.…
https://www.youtube.com/watch?v=q9dgjYXcL64&embeds_referring_euri=https%3A%2F%2Fecragroup.com%2F ECRA’s brand new Illinois Report Card Analysis report is designed to help districts extract positive messages through a more accurate analysis of state report card data, all in one turn-key and easy to understand PDF for board and community reporting. IL Data Briefs
Effective communication of data starts by communicating what truly matters in your community. In this video, Dr. John Gatta, CEO of ECRA Group, provides guidance on how to report data and how to identify what numbers are most important in communication efforts at your school district. Dr. Gatta shares a simple three-step process you can…
https://www.youtube.com/watch?v=_xbPPRbvTH8&t=1s How do you know which programs are having the greatest impact on student outcomes? Utilizing ECRA’s School Improvement solution or by purchasing our Academic Return on Investment (A-ROI) Data Brief, you be able to quantify the impact of a particular program or intervention on student growth.
In the August 2022 issue of School Administrator magazine, published by The School Superintendent’s Association (AASA), Dr. John Gatta, CEO of ECRA Group, contributed an article on the topic of academic return on investment (ROI). The article can be viewed, in context, via AASA’s digital magazine. For your convenience, the article is also posted below.…
The ECRA Strategic Dashboard is a powerful tool that encourages district leaders to think differently about student success and school quality. The strategic dashboard provides an infrastructure for school districts to build their own school report card at the local level against a local definition of quality. It provides a framework for the superintendent to…
Dr. John Gatta from ECRA Group and Dr. Erika Schlichter from Huntley 158 presented on the topic of Academic Return on Investment (ROI). In this webinar, Dr. Gatta explained best practices for measuring Academic Return on Investment (ROI) and Dr. Schlichter presented a case study from her school district. This livestream was presented in conjunction…
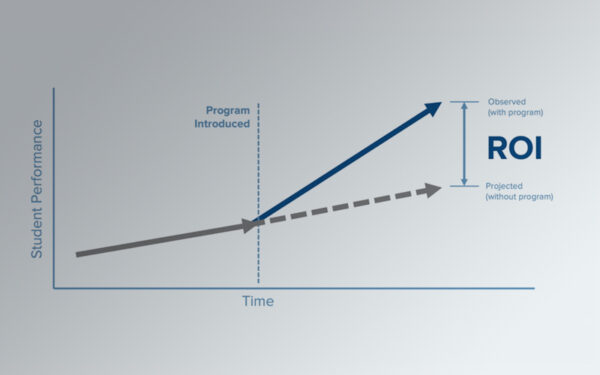
https://www.youtube.com/watch?v=nYhgtp1tba0 Documenting the Academic Return on Investment (ROI) for programs and school improvement efforts is the essence of evidence-based practice. When evaluating the success of a particular program, districts often ask: “How did students in the program grow?” While this question is important, the answer does not reflect academic ROI. Instead, academic ROI asks: “How…
The fundamental purpose of setting school improvement goals is to assess the effectiveness of improvement efforts. The utility of the school improvement process rests on the inferences one can draw from meeting a goal. For example, a typical school improvement goal may be “increase the percentage of students meeting standards in grade 4 reading by 5%. While this type of goal is specific and concise, the results will provide little to no information as to the effectiveness of improvement efforts. Why? Because increasing grade 4 reading by 5% is likely an arbitrary goal that is unrelated to school performance and not evidence-based.
Despite widespread use of effect sizes across industries as a standardized measure of impact, effect size calculations remain one of the most incorrectly applied and misinterpreted statistics. An effect size is nothing more than a standardized comparison, or “effect” , that captures the difference between an average value and a meaningful comparison in the metric of standard deviation.