Your data. Your comparisons. Your Data Briefs. Now online.
For years, ECRA Data Briefs have helped district leaders turn complex state report card data into clear, meaningful analysis.
Now, Data Briefs are available in a new interactive online experience, giving leaders more flexibility to explore results, create custom comparisons, and better understand their data.
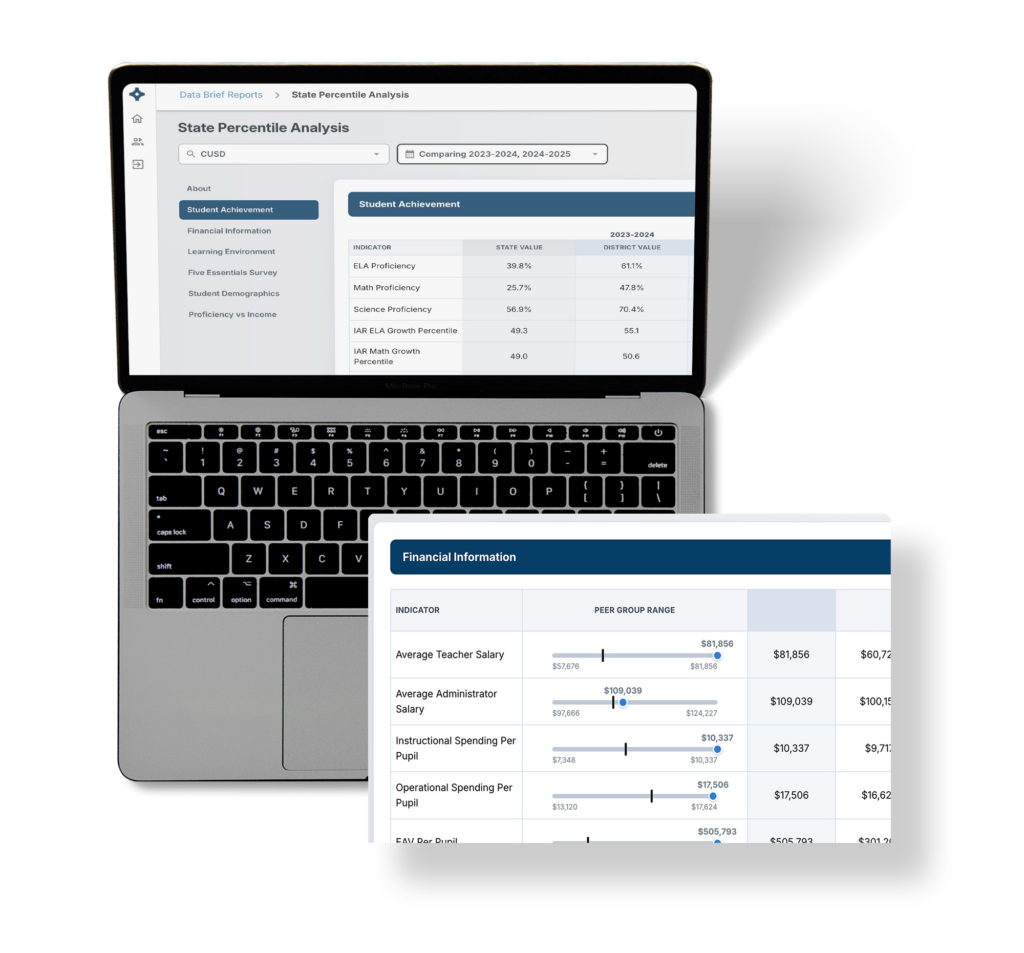

Explore your results, build the comparisons that matter, and uncover insights that help tell the story behind your state data.
Build the Comparisons That Matter to Your District
With the new online Data Briefs, users can log in and access their district and school-level reports from one convenient location. Your State Percentile Analysis provides immediate context for understanding how your results compare statewide. But now, when you want to dig deeper, you can create your own Comparative Analysis reports directly within the platform. Choose the districts or schools that matter to you, create and save peer groups, and generate new comparisons whenever you need them. There is no limit to the number of Comparative District or Comparative School Data Briefs you can create.
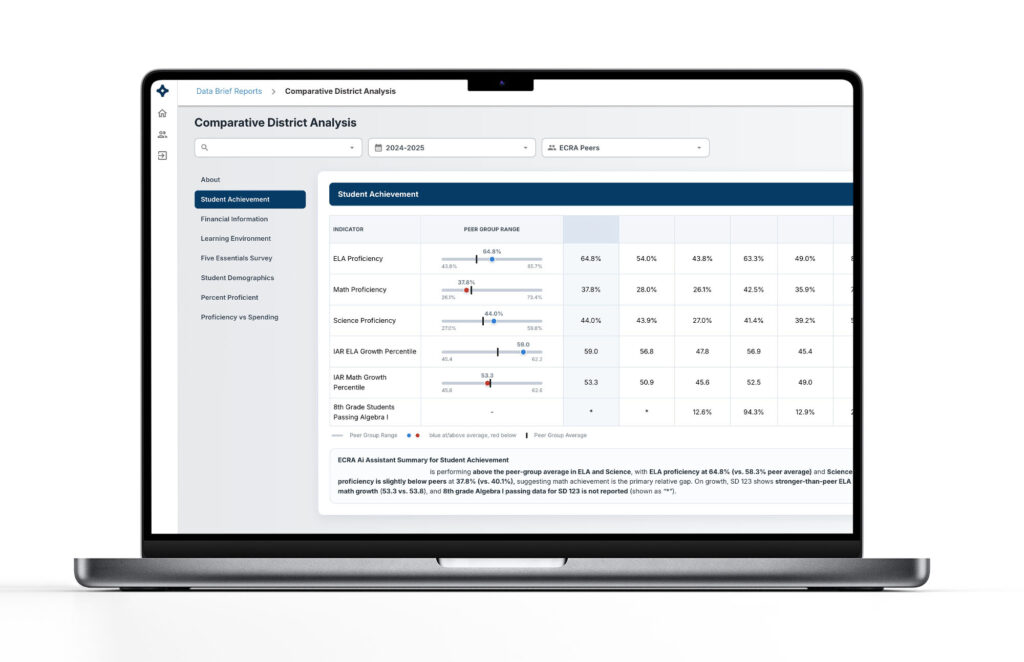
From Data to Analysis with ECRA's AI Assistant
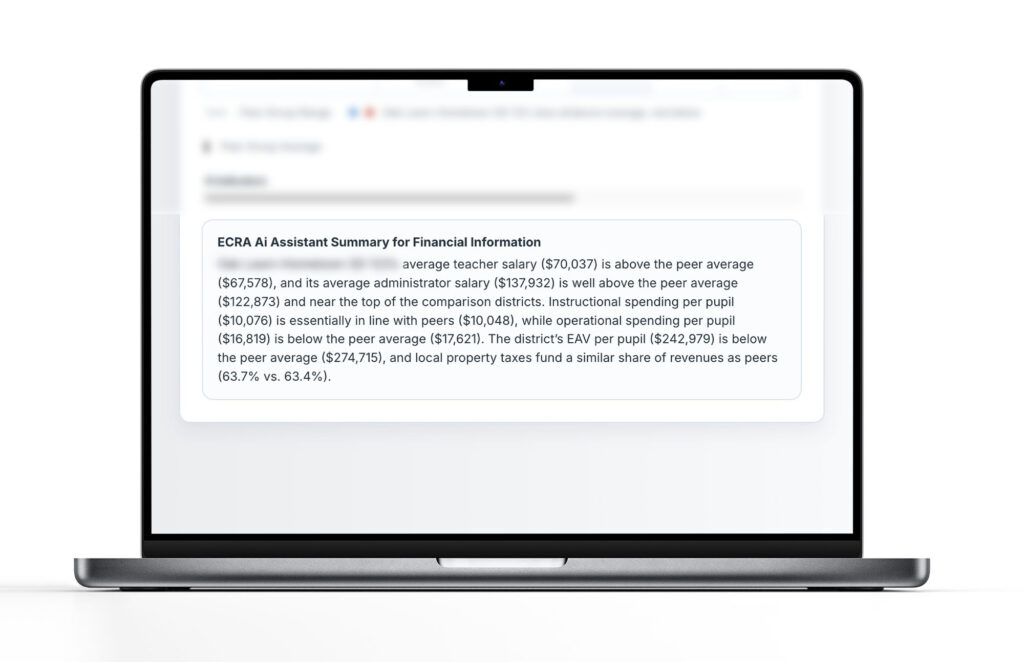
The new Data Briefs don’t just give you more ways to view your data. They help you understand what the results may be telling you. Every page of your Data Brief now includes analysis generated by ECRA’s custom AI Assistant, specifically trained to review, evaluate, and comment on ECRA Data Briefs. Instead of simply presenting another chart or table, the AI Assistant helps identify patterns, highlight notable results, and provide additional context for leaders as they review their data. It’s another layer of analysis designed to help district leaders move more quickly from “What does the data show?” to “What should we be paying attention to?”
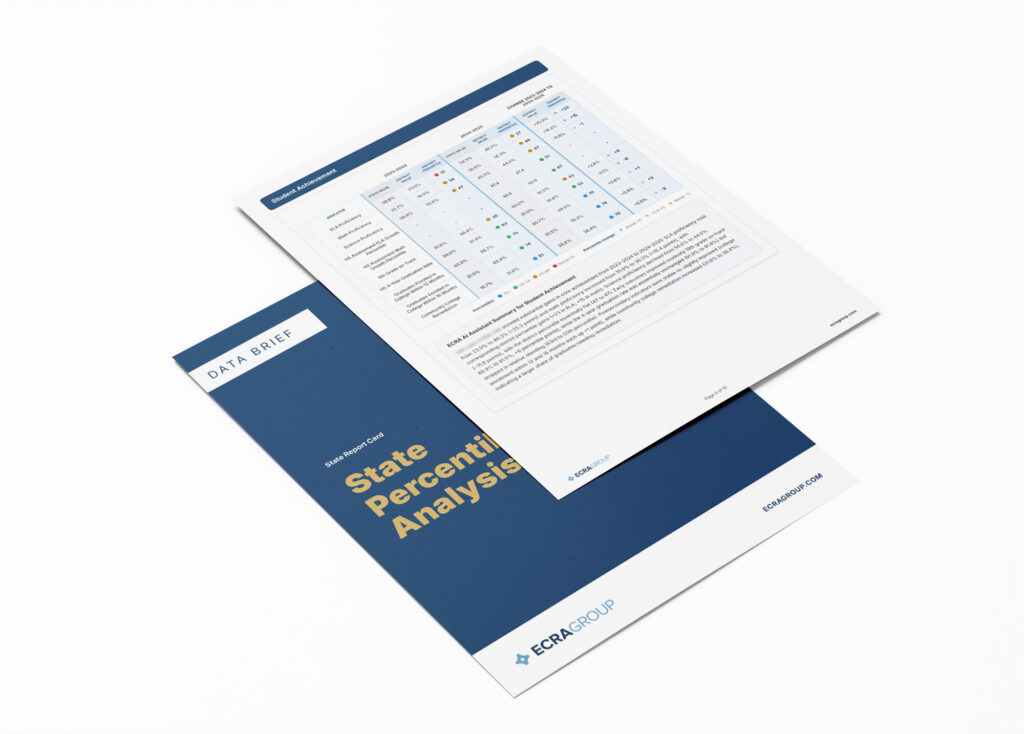
Online When You Want It. PDF When You Need It.
The Data Brief experience may be changing, but one of its most valuable features isn’t going anywhere. Every Data Brief is still available as a professionally designed PDF. Generate a report online, explore the results and analysis, then use the PDF version for board packets, leadership discussions, presentations, or communication with your community. We’ve also refreshed the design of Data Briefs to make reports easier to navigate, interpret, and share both online and in print.
What's new?
With the new ECRA Data Briefs app, districts can:
- Access the State Percentile Analysis online at the district and school level
- Create unlimited Comparative District Analysis reports
- Create unlimited Comparative School Analysis reports
- Select and save custom peer groups
- Generate new comparisons whenever needed
- View ECRA AI Assistant analysis throughout each report
- Access improved, professionally designed PDF versions of every Data Brief
- Keep district and school-level analysis together in one online experience
A Better Way to Understand Your Results
State report card data provides a tremendous amount of information. The challenge has always been turning that information into meaningful context. That’s what ECRA Data Briefs were built to do. Now, district leaders have an even more powerful way to explore that context themselves, combining rigorous comparative analysis, flexible reporting, ECRA’s expertise, and AI-powered insights in one experience.
Your results are only the beginning. See where your district stands, choose who you want to compare against, and discover what the data has to say.
Choose your option
Purchase individually or subscribe for full access.
School districts may purchase individual Data Briefs as needed or choose the annual Data Brief Subscription for broader access and expanded reporting throughout the year.
Available in: CA, IL, GA, KS, MI, NJ, NY, OH, PA, SC, TX, VA, WA, WI
Data Brief Subscription
Annual access for district and school-level reporting-
State Percentile Analysis included
-
Comparative District Analysis included
-
Unlimited district comparative analyses with different peer groups
-
School-Level Percentile Analysis available for every school in your district
-
Unlimited school-level comparative analyses
-
Future Data Briefs included during the subscription year
Percentile Analysis
District-level State Percentile Analysis-
Benchmarks district results to statewide percentiles
-
Provides context for state report card metrics
-
Helps tell a clearer district performance story
-
Optional school-level percentile reports: $500 per school
Comparative Analysis
District-level Comparative District Analysis-
Compares your district against up to 9 selected peer districts
-
Creates local context for performance, demographics, and outcomes
-
Supports board, leadership, and school improvement conversations
-
Optional school-level comparative reports: $500 per report