


Or, if you prefer to be billed directly, please contact us.
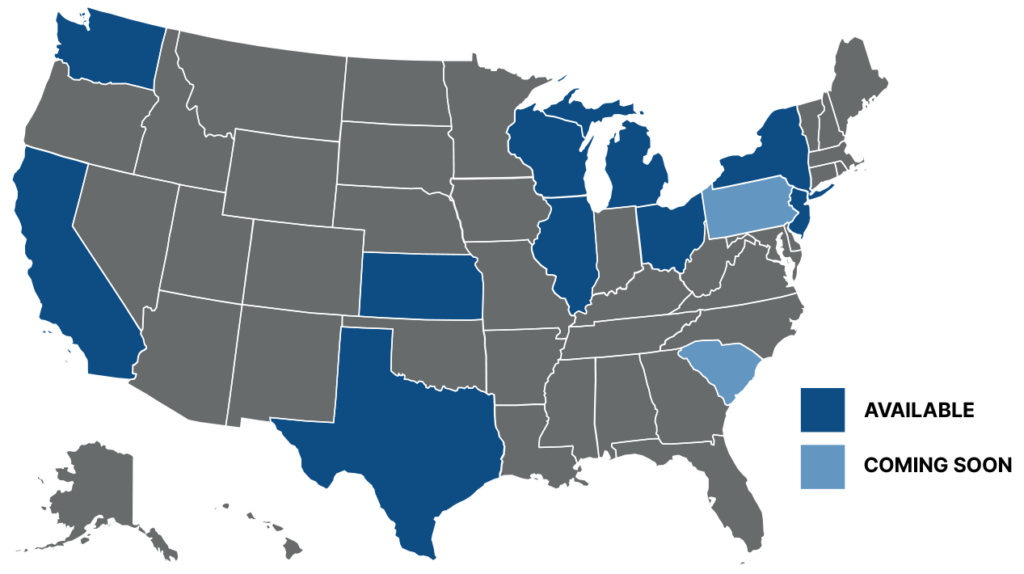
Currently, ECRA’s State Report Card Analysis is offered to school districts in CA, IL, KS, MI, NJ, NY, OH, TX, WA, and WI. With additional interest, we will offer this report to districts across the country. Please contact us directly to inquire about a report for your state.
ECRA’s State Report Card Analysis costs school districts just $2500. Upon purchase, the PDF will be delivered within 2 business days.
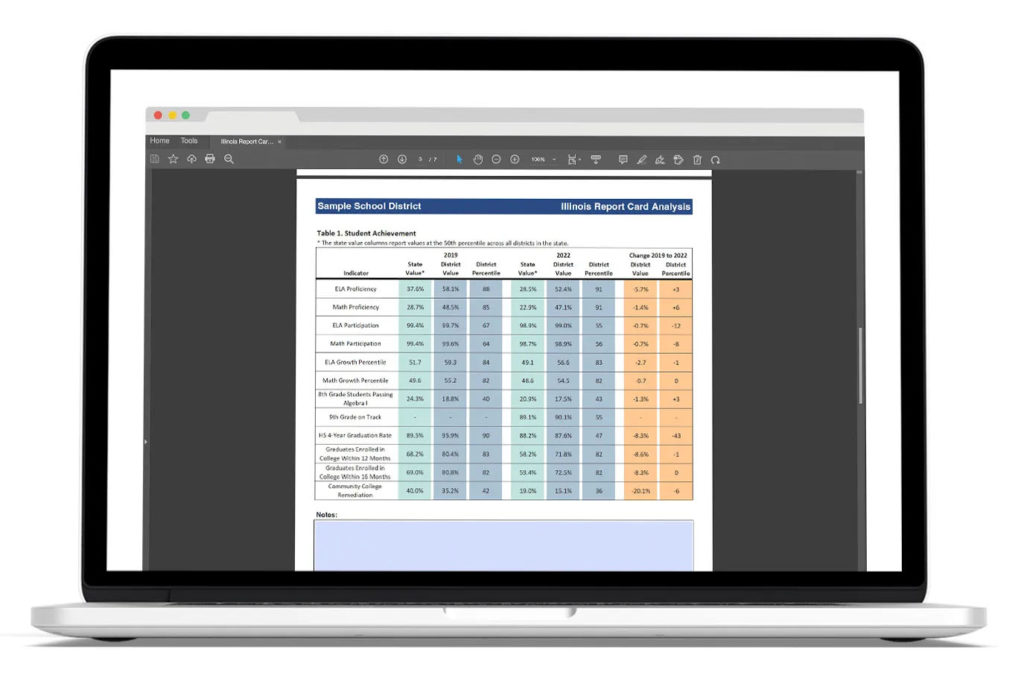
This report, custom created for your district, will be delivered to you as a PDF file. The PDF has editable sections so that you may customize and save with the explanations your board and community needs.
Great question! ECRA provides a number of ongoing learning opportunities for clients. Visit our events page to sign up for a session and learn how to use your new report.
Yes! ECRA provides samples of all the Data Briefs in our catalog. Fill out this short form and we’ll send samples to you.
This video, created about the Illinois Report Card Analysis, applies to all states and not just report cards purchased by Illinois school districts. Note, each state’s report will be slightly different due to variances from state to state.
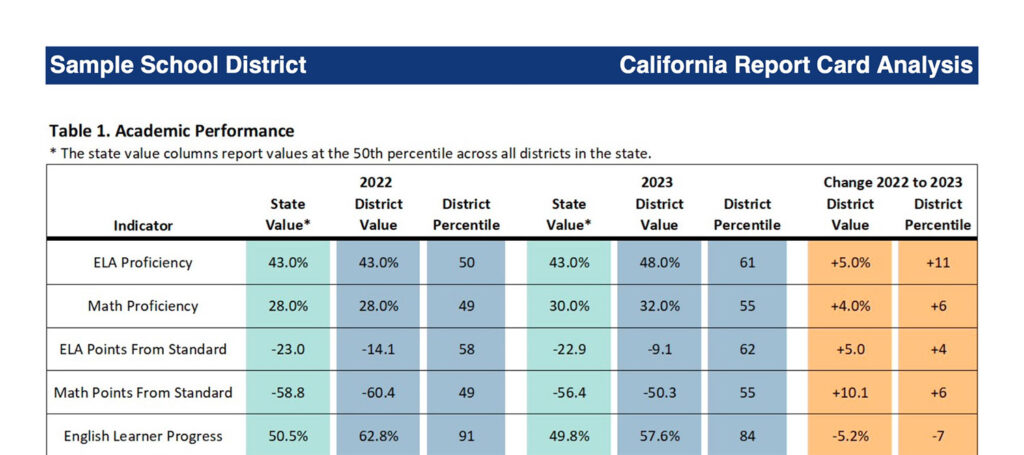
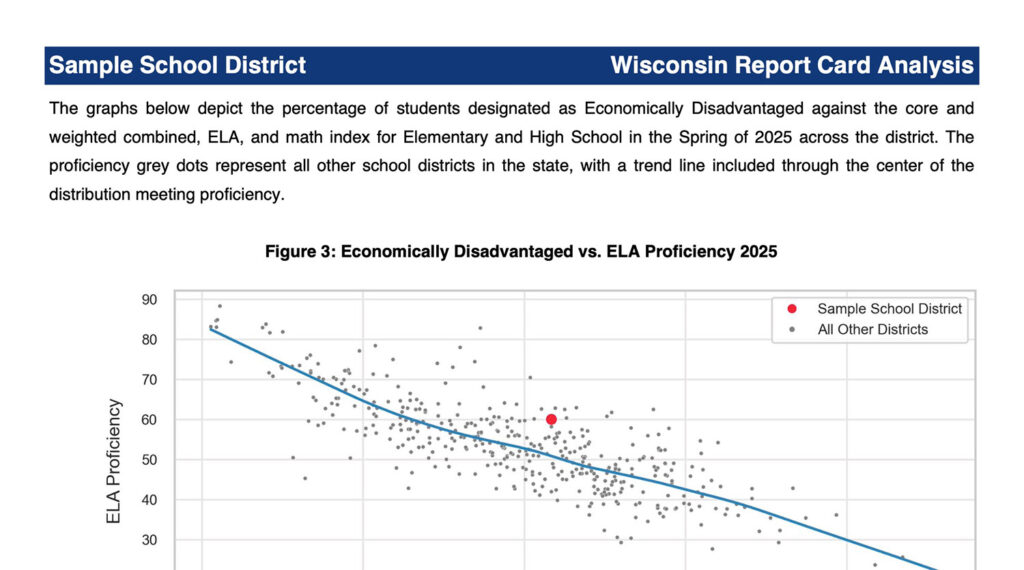
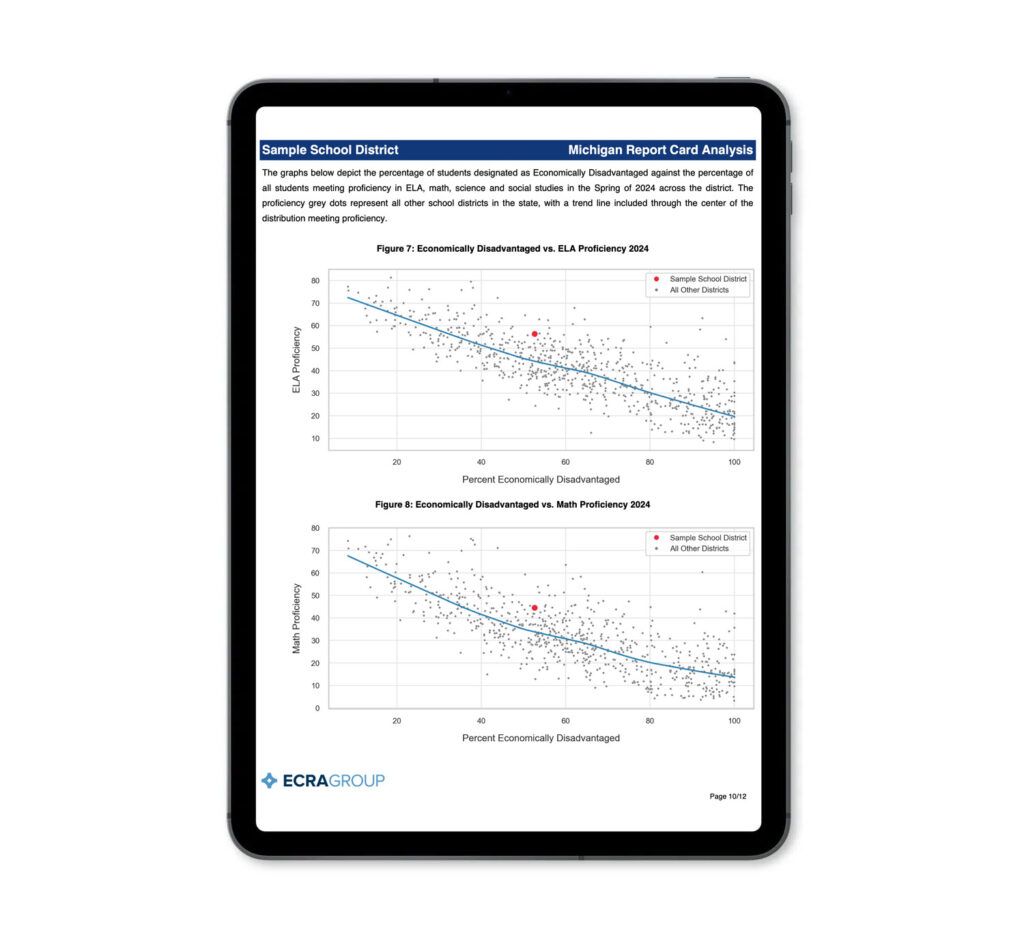
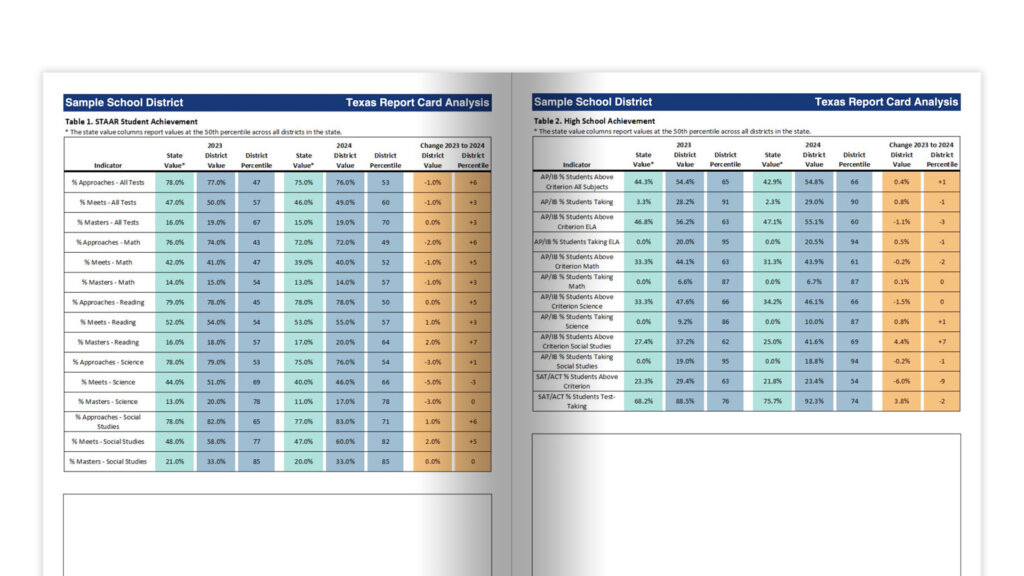
Simply reporting percentages from the state report card does not give the full picture of student achievement. Metrics reported on state report cards need to be put in context so that the board and community have a more complete picture of how the district is performing. ECRA’s State Report Card Analysis converts raw report card metrics to percentiles that are easier to communicate, easier to understand, more accurate, and more contextualized.
Percentiles can be used to compare performance across indicators and over time to answer important questions such as:
Analyzing data on State Report Cards takes significant time and energy, even for the most productive data scientist. Let the experts at ECRA provide a simple to understand analysis that can be immediately shared with the board and community by a trusted third party.
Get ECRA insights, research, webinars, and resources for school district leaders delivered to your inbox.
You’re now connected with ECRA.
