The data is already publicly available. The return comes from how quickly your district can turn it into rankings, peer comparisons, and a clear story for your community.
See the insights inside the appEvery school district sits on the same public resource. Every year a wealth of publicly available data covers achievement, growth, attendance, graduation, and more. The data is free. The work of making sense of it is not.
Someone has to download the files, clean them, line up this year against last year, find the right districts to compare against, and build charts a board can read in one sitting. In most districts that someone is a senior leader or an analyst whose time is already spoken for.
ECRA Group built the Data Briefs online application to take that work off your team. This post walks through where the return on that investment comes from.
A district earns a return on Data Briefs in three ways. Staff hours go back to work only your team can do. Leaders see sooner where the district ranks and what needs attention. And the district gains a clearer, more credible way to share results with its board, staff, and families.
What the Data Briefs application gives you
Data Briefs is a collection of analyses built on publicly available data that your team can view online or print as a PDF. The first release is the State Report Card Analysis, which includes two Data Briefs. More will follow.
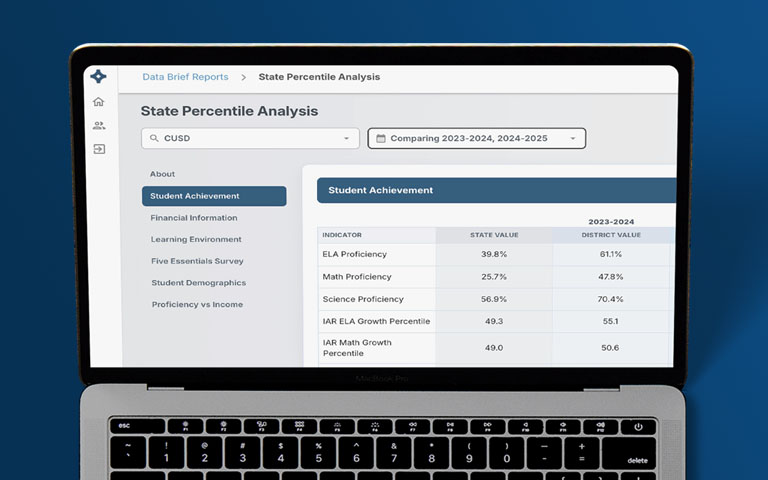
State Percentile Analysis
Shows where your district ranks among the districts in your state on the measures your state reports. A percentile turns a raw number into a position, so you know whether a result sits near the top, the middle, or the bottom of the state.
Answers the question, where do we stand?
Comparative Analysis
Places your district side by side with peer districts. You see how districts like yours are performing on the same measures and which of them are getting stronger results.
Answers the question, how do we compare with districts like us?
Two views that change the conversation
- About
- Student Achievement
- Financial Information
- Learning Environment
- Student Demographics
- Proficiency vs Income
| 2024–2025 | 2025–2026 | Change | ||||||
|---|---|---|---|---|---|---|---|---|
| Indicator | State Value | District Value | District Percentile | State Value | District Value | District Percentile | District Value | District Percentile |
| ELA Proficiency | 41.2% | 58.4% | 78 | 42.0% | 61.3% | 82 | +2.9% | → +4 |
| Math Proficiency | 28.6% | 42.1% | 71 | 29.3% | 45.6% | 79 | +3.5% | ↑ +8 |
| Science Proficiency | 47.5% | 63.2% | 72 | 48.1% | 61.8% | 68 | −1.4% | → −4 |
| ELA Growth Percentile | 50.2 | 54.7 | 66 | 50.4 | 57.3 | 73 | +2.6 | ↑ +7 |
| Math Growth Percentile | 50.1 | 52.9 | 61 | 50.0 | 55.1 | 69 | +2.2 | ↑ +8 |
| 4 Year Graduation Rate | 87.9% | 90.2% | 62 | 88.4% | 91.5% | 67 | +1.3% | → +5 |
| College Enrollment Within 12 Months | 62.3% | 68.4% | 69 | 63.0% | 66.9% | 61 | −1.5% | ↓ −8 |
- About
- Student Achievement
- Financial Information
- Learning Environment
- Student Demographics
- Percent Proficient
| Indicator | Peer Group Range | Sample School District | Peer 1 | Peer 2 | Peer 3 | Peer 4 | Peer 5 |
|---|---|---|---|---|---|---|---|
| ELA Proficiency | 61.3%48.773.1 | 61.3% | 52.4% | 66.8% | 48.7% | 73.1% | 57.6% |
| Math Proficiency | 45.6%33.459.8 | 45.6% | 37.9% | 51.2% | 33.4% | 59.8% | 48.7% |
| Science Proficiency | 61.8%49.371.2 | 61.8% | 55.1% | 66.4% | 49.3% | 71.2% | 58.9% |
| ELA Growth Percentile | 57.347.257.3 | 57.3 | 49.8 | 53.1 | 47.2 | 56.4 | 51.6 |
| Math Growth Percentile | 55.148.956.8 | 55.1 | 50.6 | 54.2 | 48.9 | 56.8 | 52.3 |
| 4 Year Graduation Rate | 91.5%85.994.6 | 91.5% | 88.3% | 92.7% | 85.9% | 94.6% | 89.1% |
| College Enrollment Within 12 Months | 66.9%58.379.6 | 66.9% | 61.8% | 72.4% | 58.3% | 79.6% | 70.7% |
Sample School District ranks 1above the middle of the state on nearly every measure and 2climbed in math and growth. Against its peers, 3math proficiency and college enrollment sit below the peer average, and 4Peer 4 leads on both.
That is a priority and a peer worth calling, found in minutes instead of weeks.
Seven places the return shows up
- 1
Your staff get their time back
Building a statewide ranking by hand means gathering files, checking definitions, and rebuilding the same charts every year. Data Briefs does that work before you log in. The hours your team would have spent go to instruction, planning, and the questions only they can answer.
- 2
Results arrive quickly and come from experts
The analysis is ready when you need it. It is prepared by a third party whose researchers bring years of experience with school district data. That independence matters. A board or a community tends to trust a ranking more when the district did not calculate it for itself.
- 3
See what needs your focus
Percentiles make priorities plain. A district can be proud of a proficiency rate and still learn it sits in the middle of the state. Another measure may look ordinary and turn out to be a statewide strength. Knowing the difference tells you where to put attention and money.
- 4
Year over year and historic views take seconds
Trend questions come up in every board meeting. Are we improving? Since when? Compared with whom? Data Briefs keeps prior years in place, so a year over year comparison or a longer historic view is already there when someone asks.
- 5
Find peers worth calling
The most useful comparison is often a district that looks like yours and is getting better results. The Comparative Analysis helps you spot those districts. A conversation with a peer who has solved the problem in front of you can be worth more than any report.
- 6
Know where you stand when families have a choice
In open enrollment states, families can compare districts and enroll across boundaries. Enrollment follows perception, and in most states funding follows enrollment. Districts in these states need to know exactly where they rank and how nearby and similar districts are performing. Data Briefs gives you that picture before families form their own.
- 7
Change the way your district communicates data
A percentile is easier to explain than a scale score. A peer comparison is easier to defend than a single number with no context. With clear views you can show online or hand out as a PDF, your district tells its own story with evidence that stays consistent from one meeting to the next.
See where your district stands
See a sample Data Brief built for your district, or ask ECRA Group for a walkthrough using data from your own state.
Tell us which reports interest you and where to send them.
Frequently asked questions
What are Data Briefs?
Data Briefs is an online application from ECRA Group that turns publicly available data into ready to use analyses for school districts. Districts view each Data Brief online or print it as a PDF.
What is the difference between the State Percentile Analysis and the Comparative Analysis?
The State Percentile Analysis shows where your district ranks among the districts in your state. The Comparative Analysis places your district side by side with peer districts on the same measures. Together they form the State Report Card Analysis.
How does a school district measure the return on investment of Data Briefs?
Start with the staff hours your district spends each year gathering, cleaning, and charting publicly available data, then multiply by the cost of that time. Compare that figure with the cost of the application. Then weigh the gains that are harder to count, such as faster answers, clearer priorities, and more credible communication.
Why does third party analysis matter?
An independent analysis carries more weight with boards, staff, and families than figures a district calculates about itself. It also brings the experience of researchers who work with school district data every day.
Do Data Briefs work for districts in any state?
Data Briefs are built on publicly available data, so the approach applies in any state. Contact ECRA Group to confirm what is available for your state.